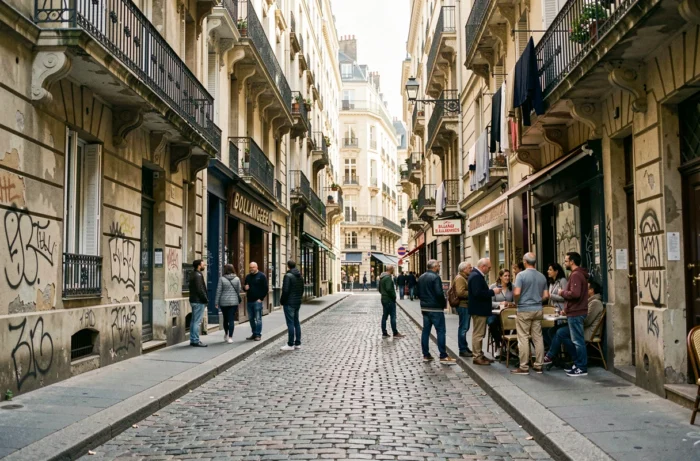
When we talk about “sensitive neighborhoods” in France, two realities overlap. The first is administrative: defined perimeters set by the State to target public policies. The second is felt: areas where insecurity, precariousness, or urban tensions mark daily life. Understanding the difference between these two readings is the foundation for correctly interpreting a map of sensitive areas.
Priority neighborhoods and sensitive areas: what the official perimeters really measure
You may have already seen colorful maps intended to show the “dangerous neighborhoods” of France. Most rely on outdated or misinterpreted data. To see clearly, one must return to the official definitions.
The former Sensitive Urban Zones (ZUS), created in 1996, have given way to Priority Neighborhoods of the City Policy (QPV). These perimeters do not designate “lawless zones.” They identify territories where the income of residents is significantly below the surrounding average, triggering targeted public assistance.
The priority geography was updated on January 1, 2024 in mainland France, and then on January 1, 2025, in overseas departments and regions. This work, conducted by the ANCT and the prefectures using data from INSEE, has modified the boundaries of many neighborhoods. Any map that does not incorporate this recent update displays obsolete perimeters.
Special case: since January 1, 2026, the entire department of Mayotte is classified as QPV, a unique situation in France that disrupts the usual reading of sensitive areas on a national scale. You can discover the hot neighborhoods on Essentium to visualize these changes on an updated interactive map.
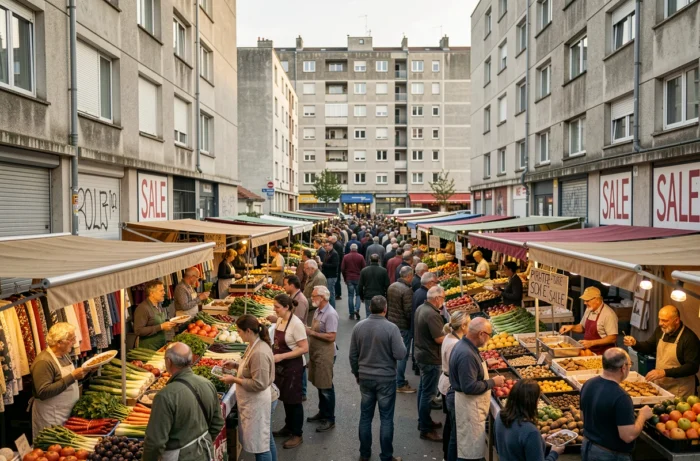
Urban heat islands and vulnerability of sensitive neighborhoods in France
The term “hot neighborhood” also has a literal meaning that urban planners take very seriously. Urban heat islands (UHI) hit certain territories harder, and they are not always the ones we imagine.
The link between built density and local temperature
A densely built neighborhood, with little vegetation and many impermeable surfaces (asphalt, concrete), stores heat during the day and releases it at night. This phenomenon, called urban heat island effect, can create significant temperature differences between the center of a city and its outskirts.
Priority neighborhoods often accumulate several aggravating factors: large housing estates built in the 1960s-1970s, low vegetation cover, poorly insulated housing. During heatwaves, these territories become thermal vulnerability zones where fragile populations (the elderly, children, chronically ill) are the most exposed.
Local Climate Zones to map thermal sensitivity
Researchers use a classification system called Local Climate Zones (LCZ) to characterize the physical structure of a neighborhood and its thermal response. This grid distinguishes about fifteen types of built and natural environments.
Applying this system to a city allows for the identification of areas most exposed to heat spikes. Paris, Lyon, and Marseille have been the subject of detailed mappings according to this model. The results show that the neighborhoods most vulnerable to heat often overlap with the perimeters of QPV, although this overlap is not systematic.
Delinquency and insecurity: what recent statistics say
Automatically associating “sensitive neighborhood” with “delinquency” is a shortcut. The figures published by the Ministry of the Interior’s Statistical Service (SSMSI) paint a more nuanced picture.
- Residential burglaries saw a notable increase during the summer of 2026, with over 18,665 homes targeted in July, marking a 7.1% increase compared to the same period the previous year. This rise affects the entire territory, not just priority neighborhoods.
- Regional disparities are significant: some rural departments have burglary rates per capita higher than those of suburbs deemed “difficult.”
- Overall crime in France tends to decline in the long term, as highlighted by Alternatives Économiques in an analysis published in August 2026, even though certain categories of offenses (violence against individuals, online scams) are increasing.
A map of “hot neighborhoods” based solely on delinquency thus gives a distorted image. It ignores structural factors (poverty, unemployment, isolation) and positive dynamics (urban renewal, social cohesion programs) that transform these territories.
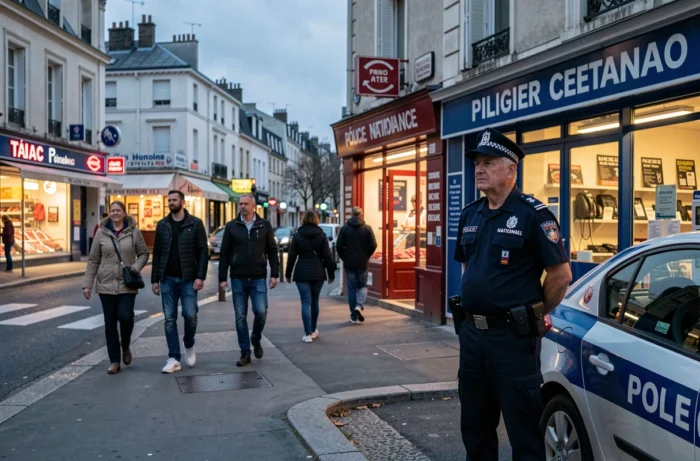
Mapping tools to analyze sensitive areas in France
Several public platforms allow for the construction of one’s own territorial diagnosis, far from sensationalist rankings.
- The SIG Ville platform, managed by the ANCT, provides access to the map of all priority neighborhoods in mainland France. It allows users to check if a specific address is located in a QPV by simply entering the postal address.
- The Territorial Observatory offers an interactive mapping tool with nearly 700 social, economic, and environmental indicators. It allows for cross-referencing data on income, employment, and health at the municipal level.
- The data.gouv.fr portal provides raw datasets on the former ZUS and current QPV, freely reusable to produce one’s own visualizations.
- Géorisques maps natural and technological risks, a useful complement for assessing the overall vulnerability of a neighborhood (flooding, industrial pollution, clay shrink-swell).
Cross-referencing these sources provides a much richer vision than a simple red blot on a map. A neighborhood classified as QPV may be undergoing significant transformation due to an urban renewal program, while an unclassified area may concentrate invisible vulnerabilities in official statistics.
Reading a map of sensitive areas always requires context. An administrative perimeter does not summarize the life of a neighborhood, its level of security, or its quality of life. Tools exist to go beyond shortcuts, provided one takes the time to consult them.